

Install Steam
login
|
language
简体中文 (Simplified Chinese)
繁體中文 (Traditional Chinese)
日本語 (Japanese)
한국어 (Korean)
ไทย (Thai)
Български (Bulgarian)
Čeština (Czech)
Dansk (Danish)
Deutsch (German)
Español - España (Spanish - Spain)
Español - Latinoamérica (Spanish - Latin America)
Ελληνικά (Greek)
Français (French)
Italiano (Italian)
Bahasa Indonesia (Indonesian)
Magyar (Hungarian)
Nederlands (Dutch)
Norsk (Norwegian)
Polski (Polish)
Português (Portuguese - Portugal)
Português - Brasil (Portuguese - Brazil)
Română (Romanian)
Русский (Russian)
Suomi (Finnish)
Svenska (Swedish)
Türkçe (Turkish)
Tiếng Việt (Vietnamese)
Українська (Ukrainian)
Report a translation problem


 A list of cool things to find in SpaceEngine (real objects only)
 All Graphics Options Explained [Updated for General Relativity]


 All Visual Style Settings Explained (WIP)

 Birth of Star


 Colliding Galaxies


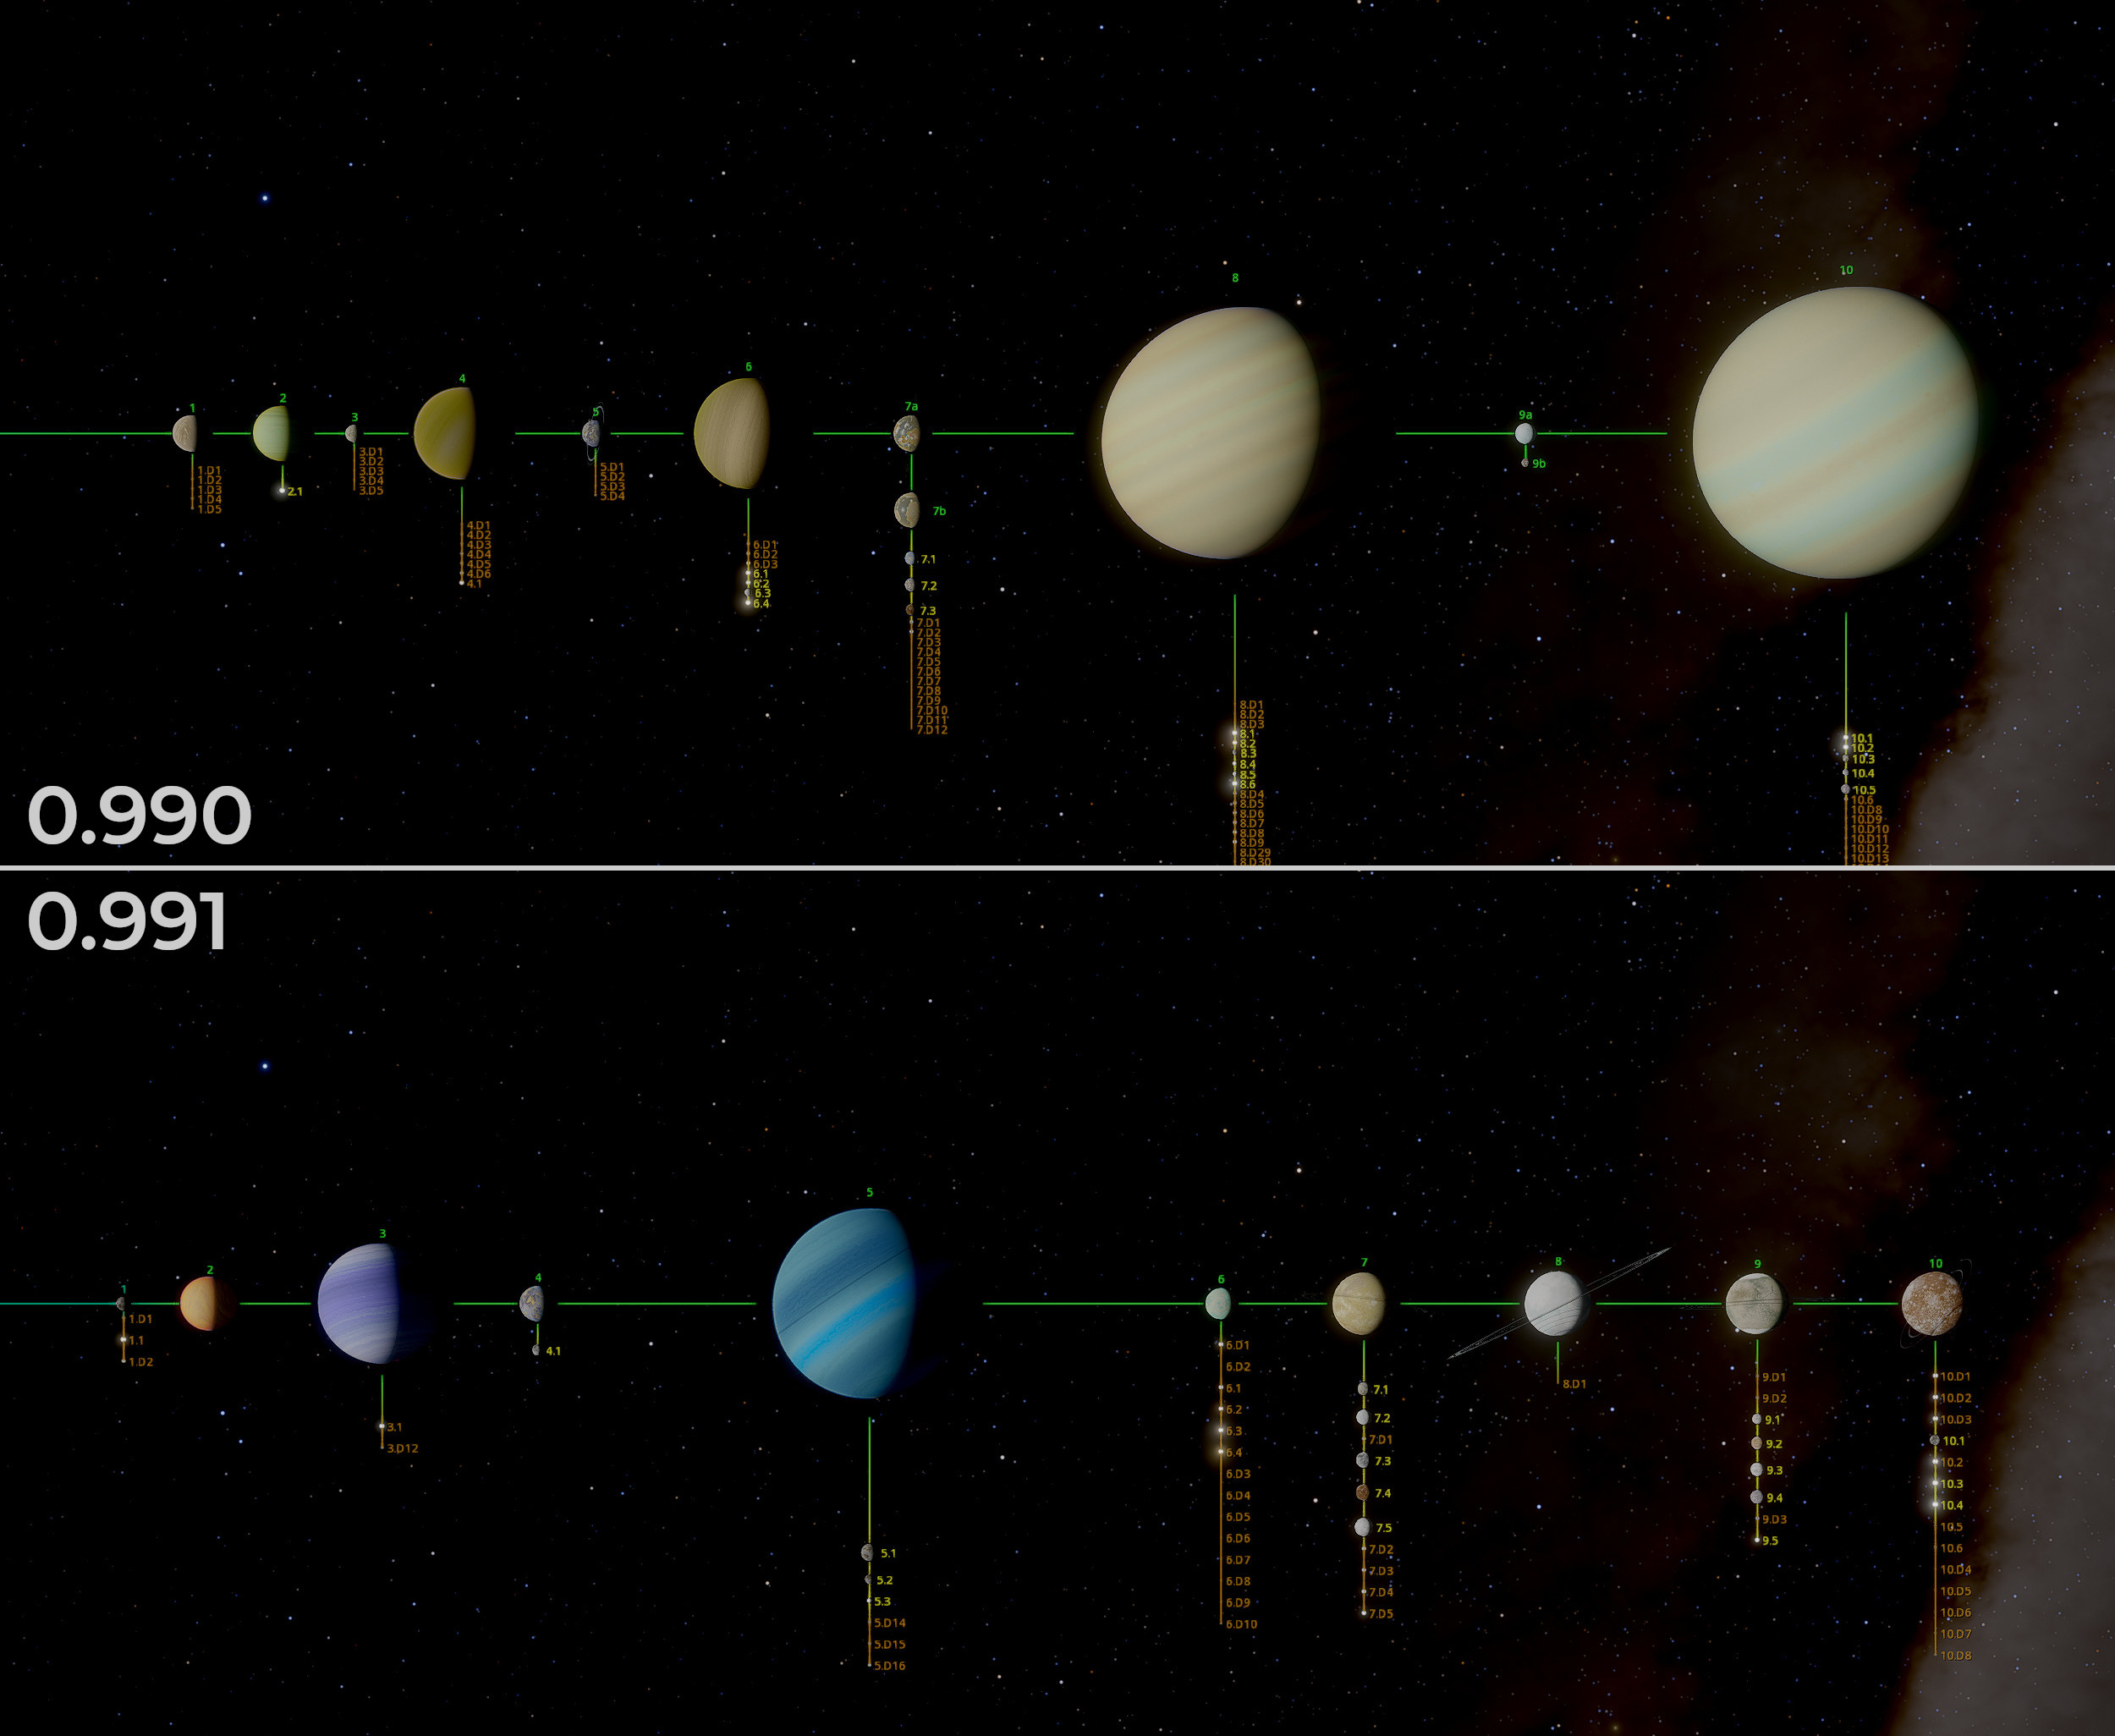 An example of planetary system generation in 0.990 (top) and 0.991 (bottom). View the blog post on our website
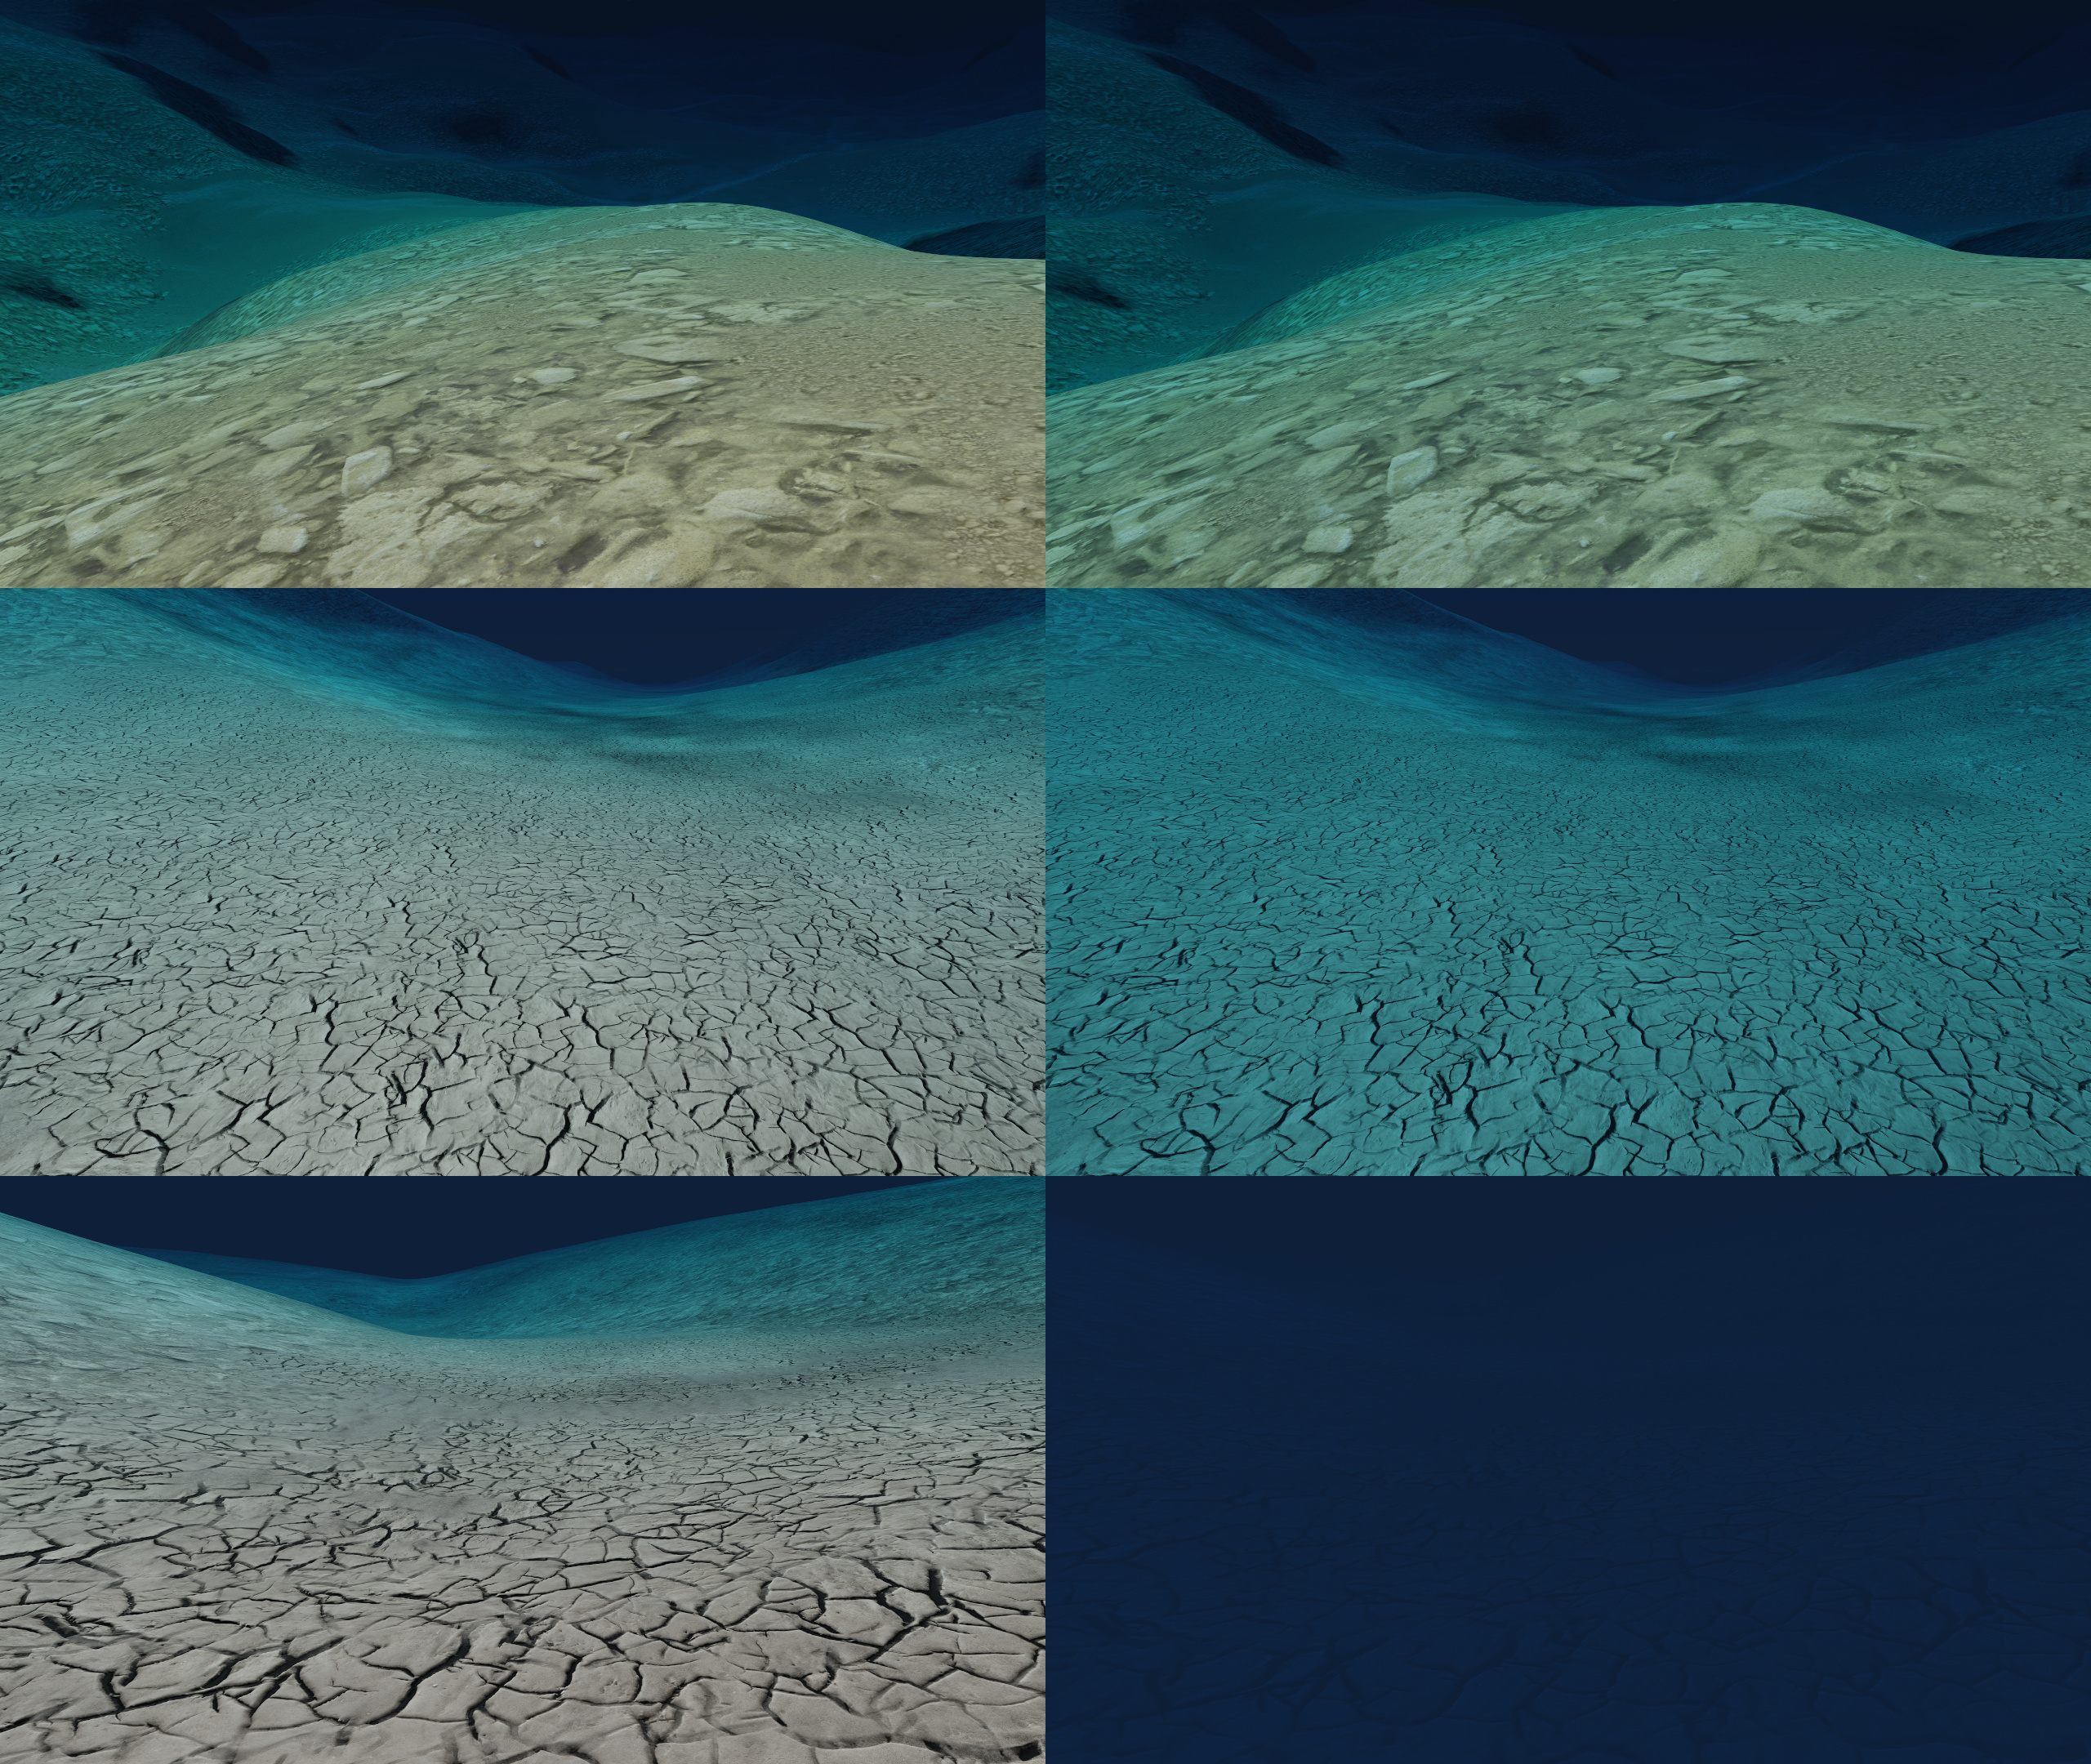 Sea floor images from a variety of depths, showing their appearance in 0.990 (left) and 0.991 (right). See the blog post on our website
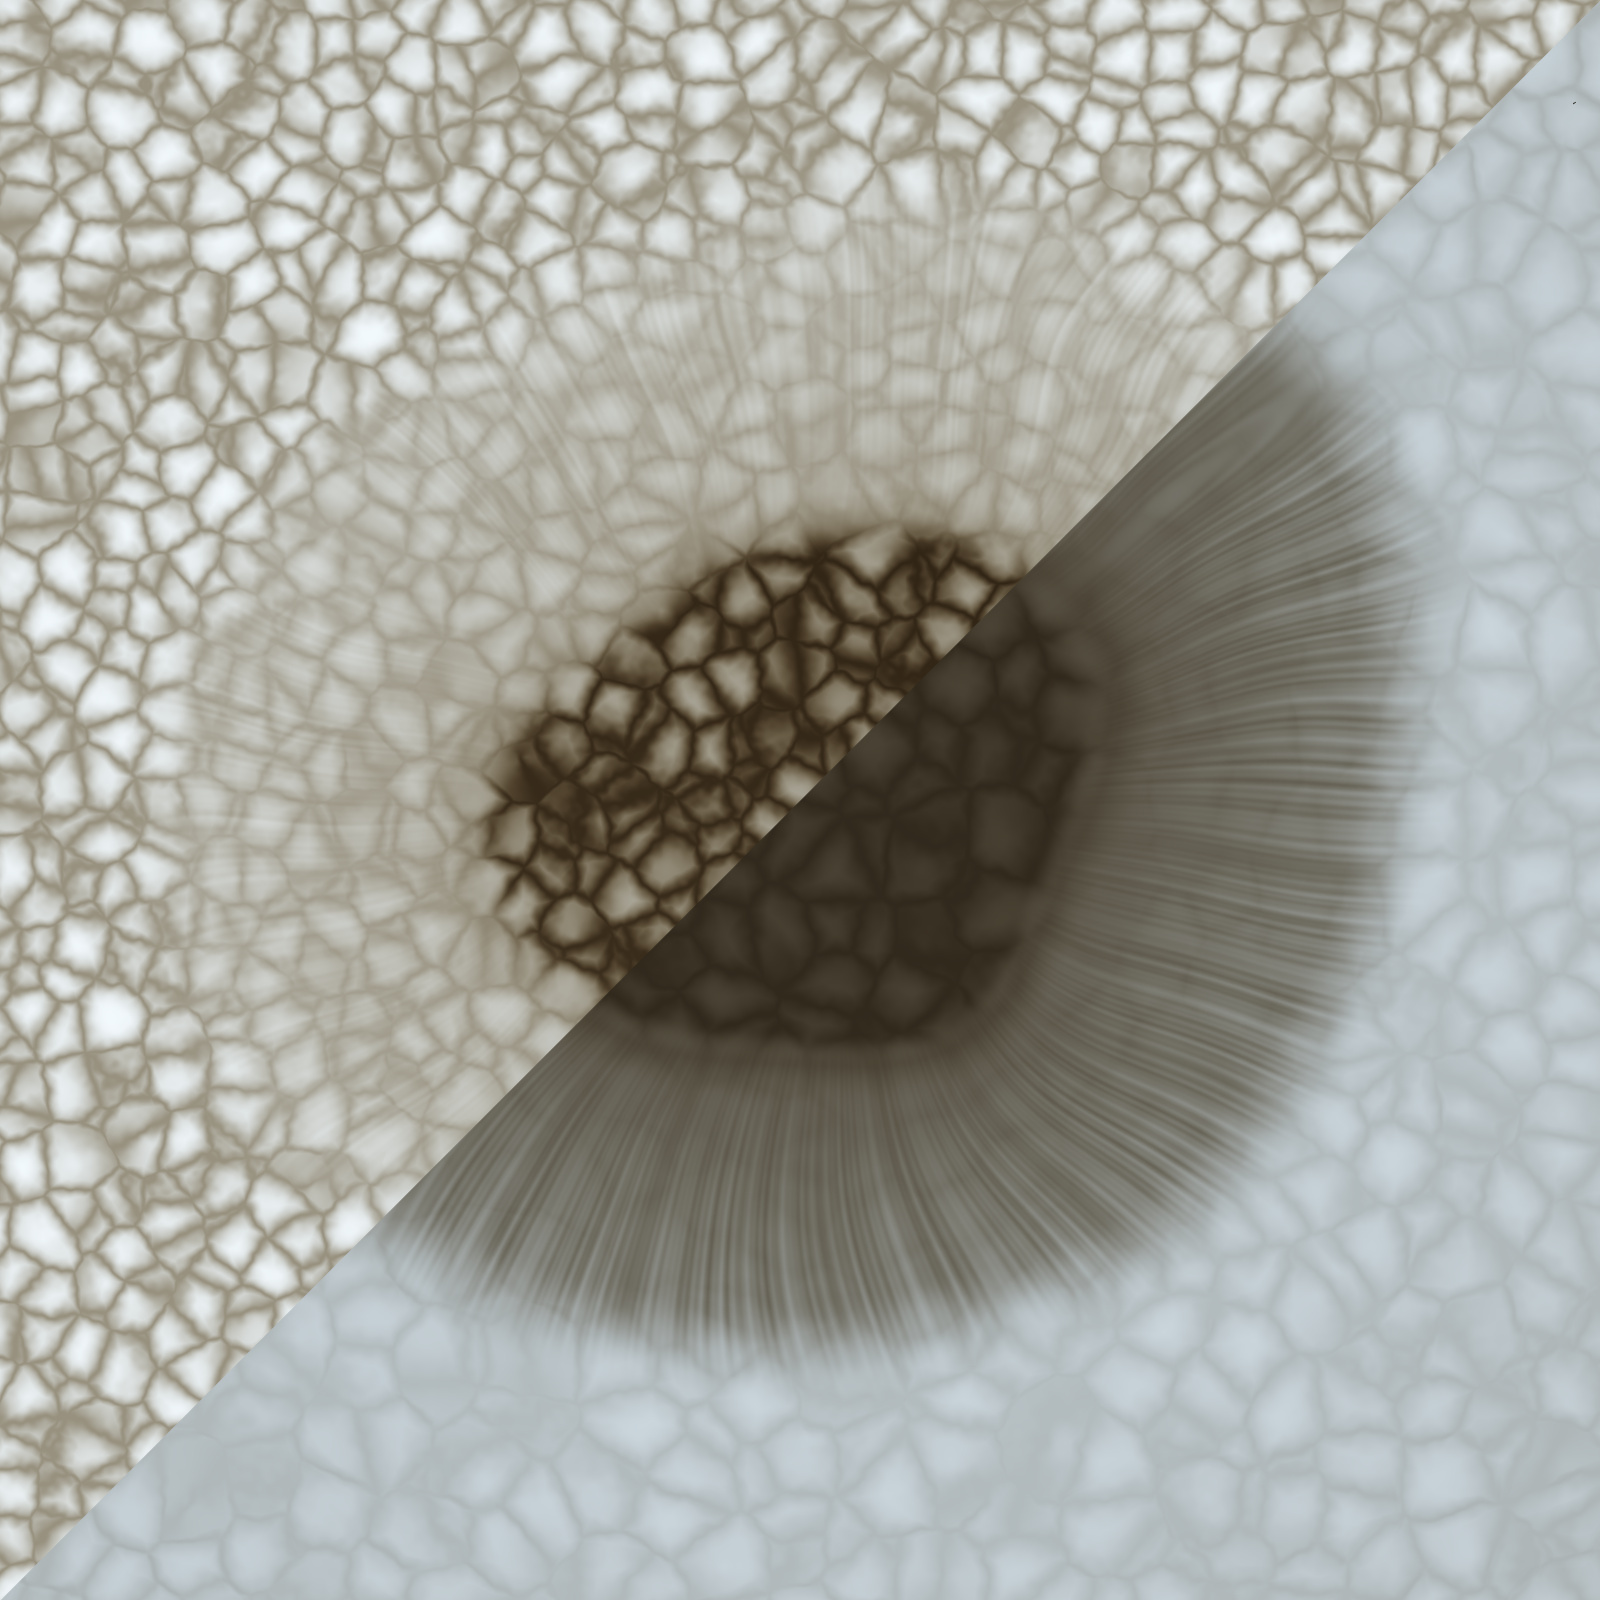 A comparison of granules and sunspots on a G2V star in 0.990 (left) and 0.991 (right). View the blog post on our website
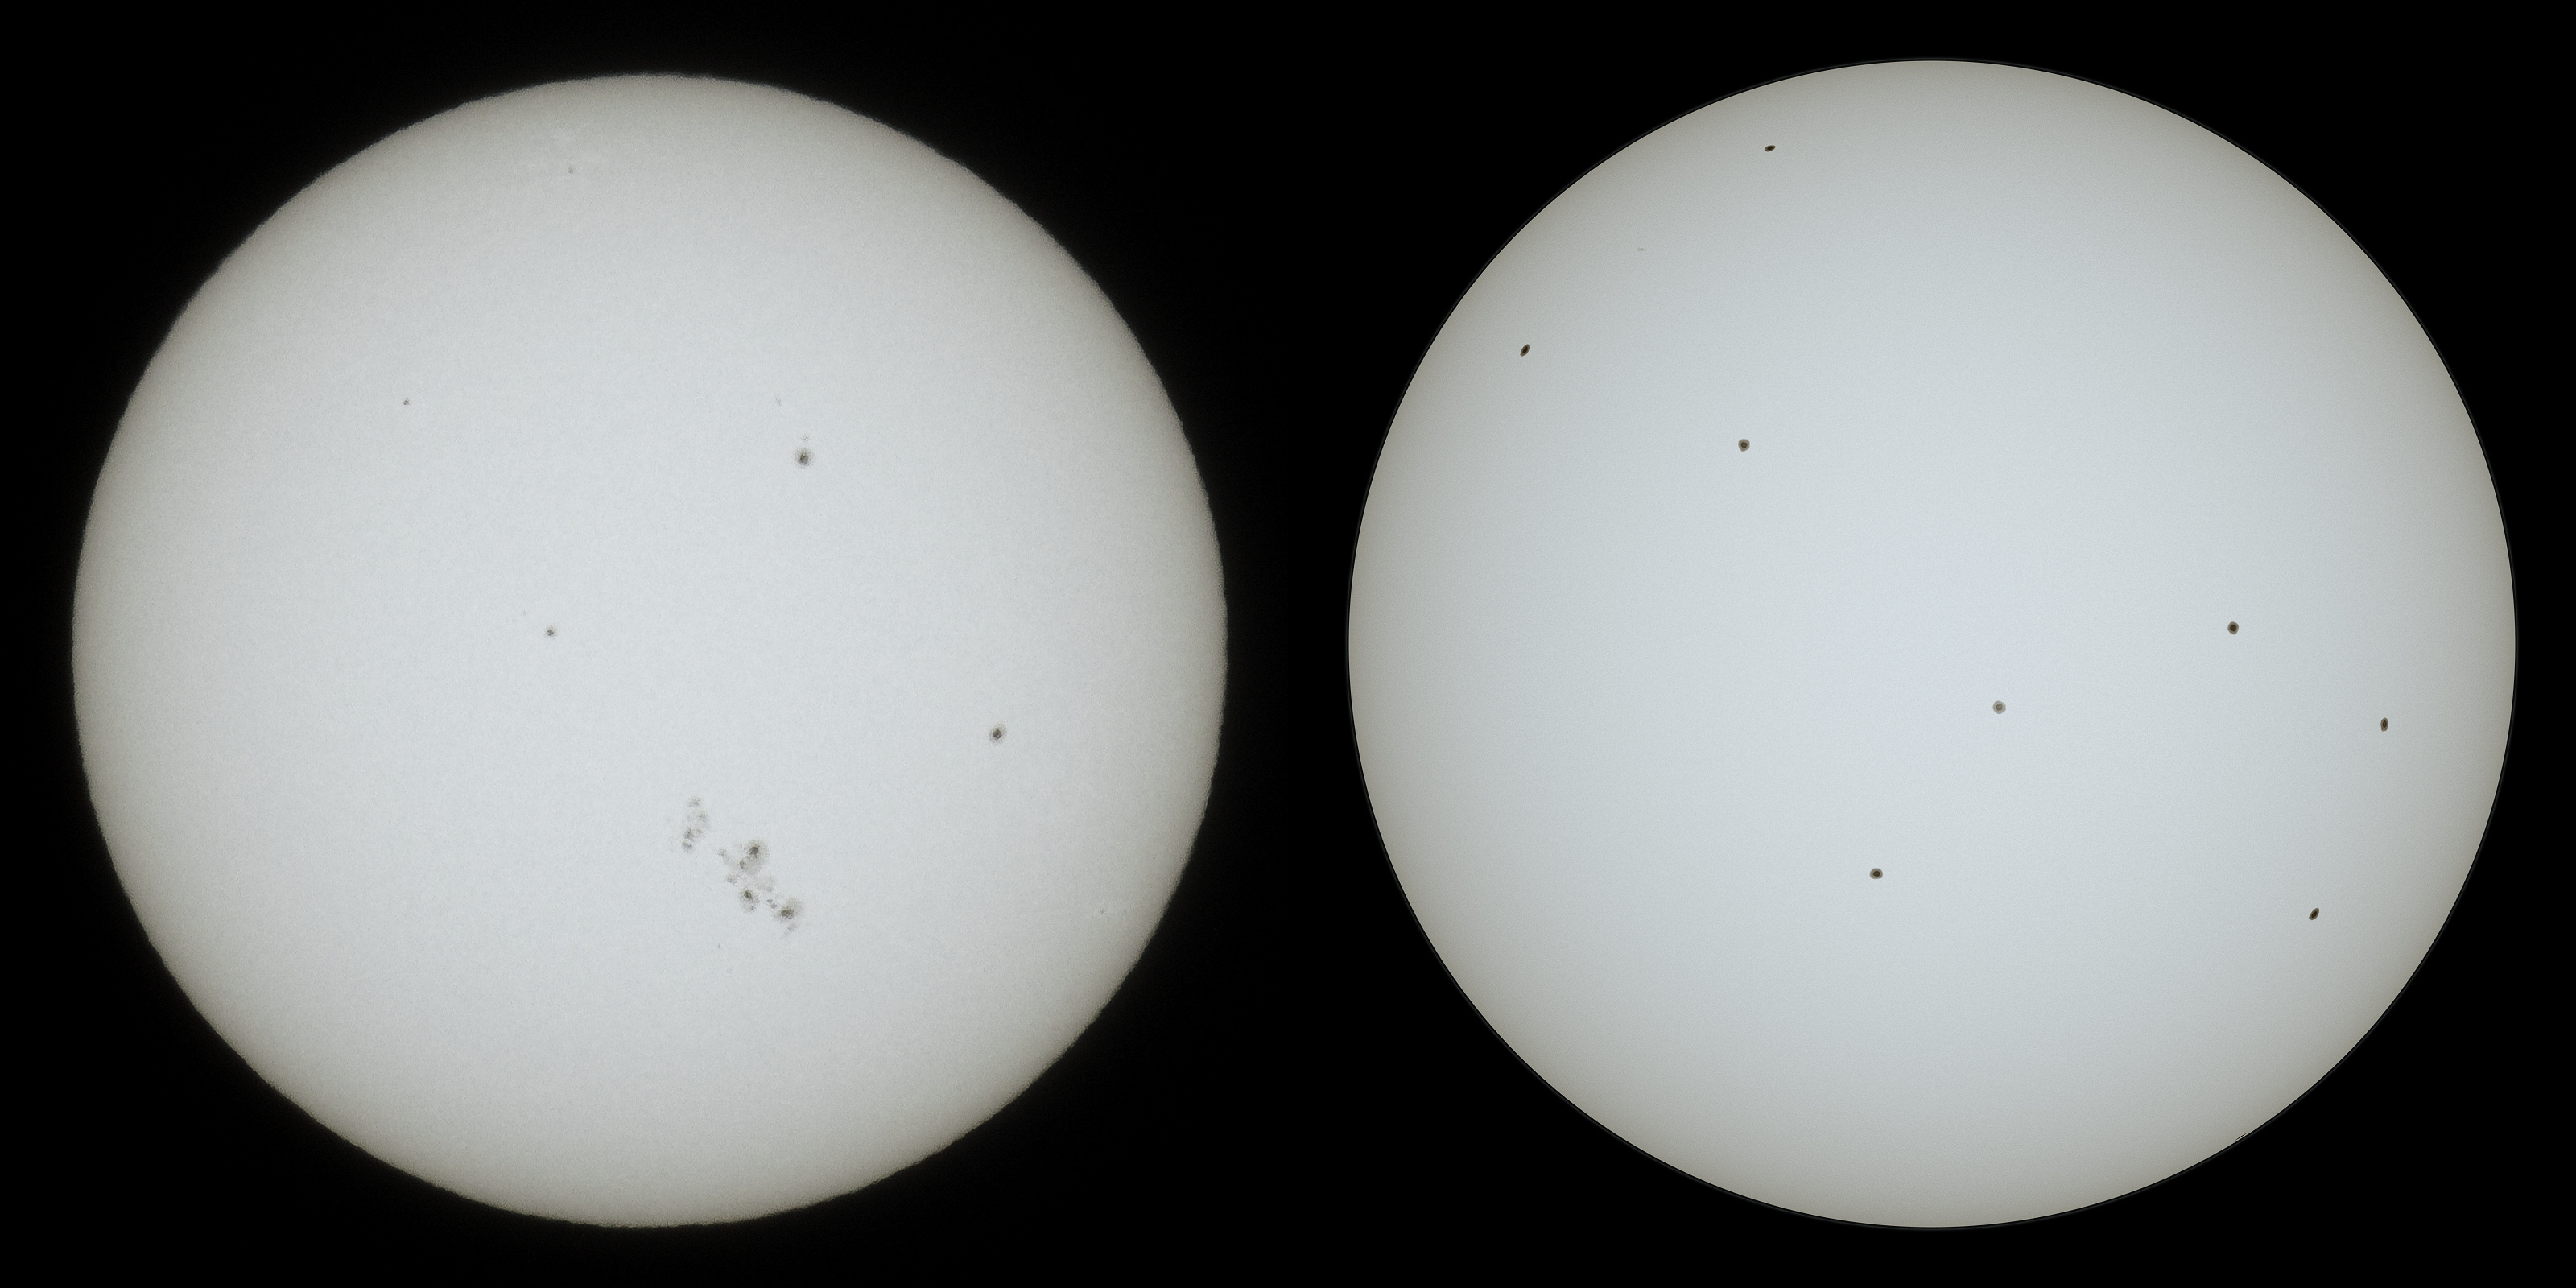 Left: A real photo of the Sun taken by one of our own team members. Right: The Sun in SpaceEngine version 0.991 with the revised granulation and sunspot temperatures.Further updates to the accuracy of star surfaces are being worked on for future release.
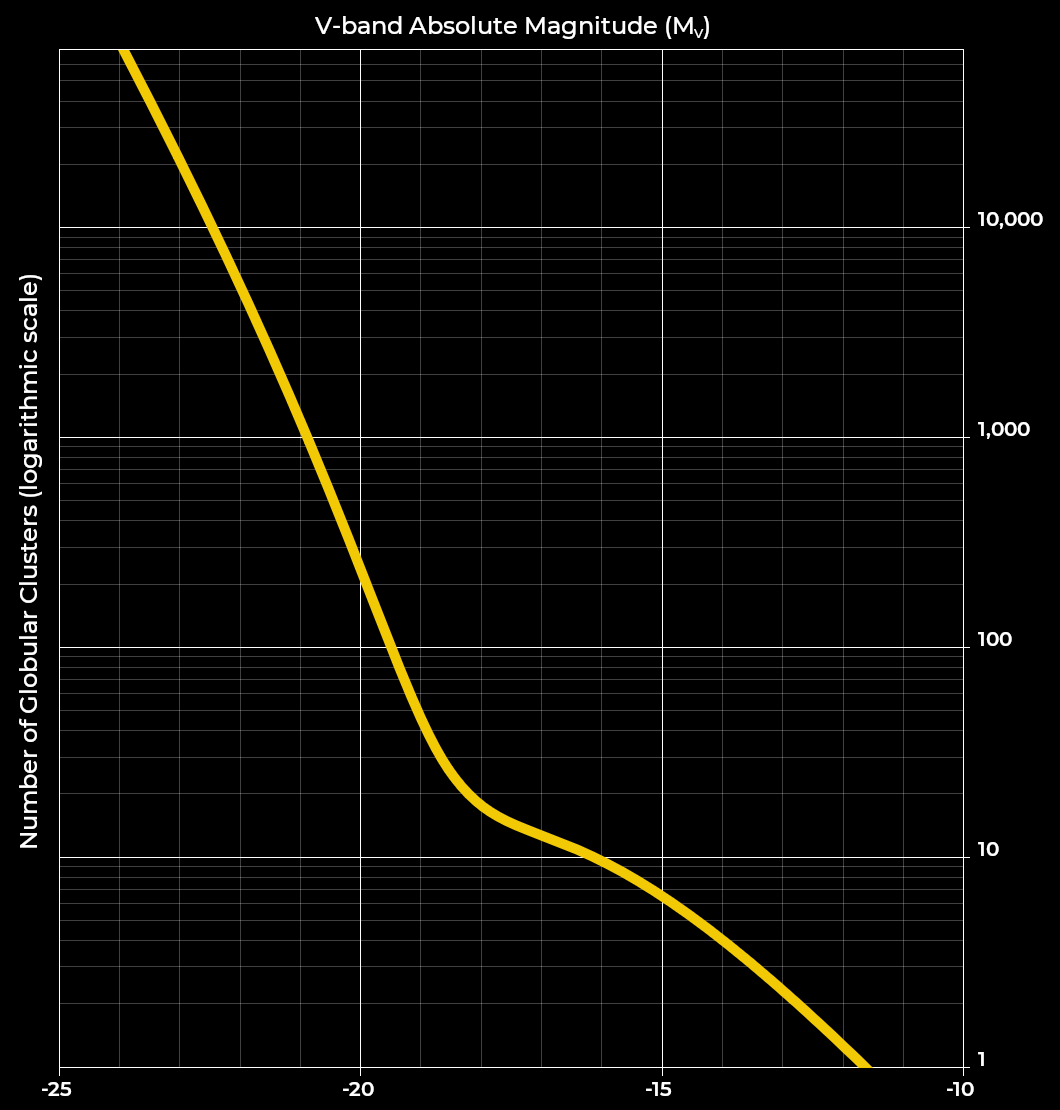 This graph shows the number of globular clusters (Y axis) that generate in elliptical galaxies in 0.991 as a function of galaxy absolute visual magnitude (X axis).Lenticular galaxies (type S0) also have their GCS generation based on a SF relation, using a single SF value that's fairly typical of the type. The SF of spiral galaxy GCSs in nature varies based on a number of variables that are beyond what SE can accurately accommodate at present, so their GC populations scale with the square of the galaxy's radius. In all cases, this results in a more realistic number of globular clusters than in 0.990.
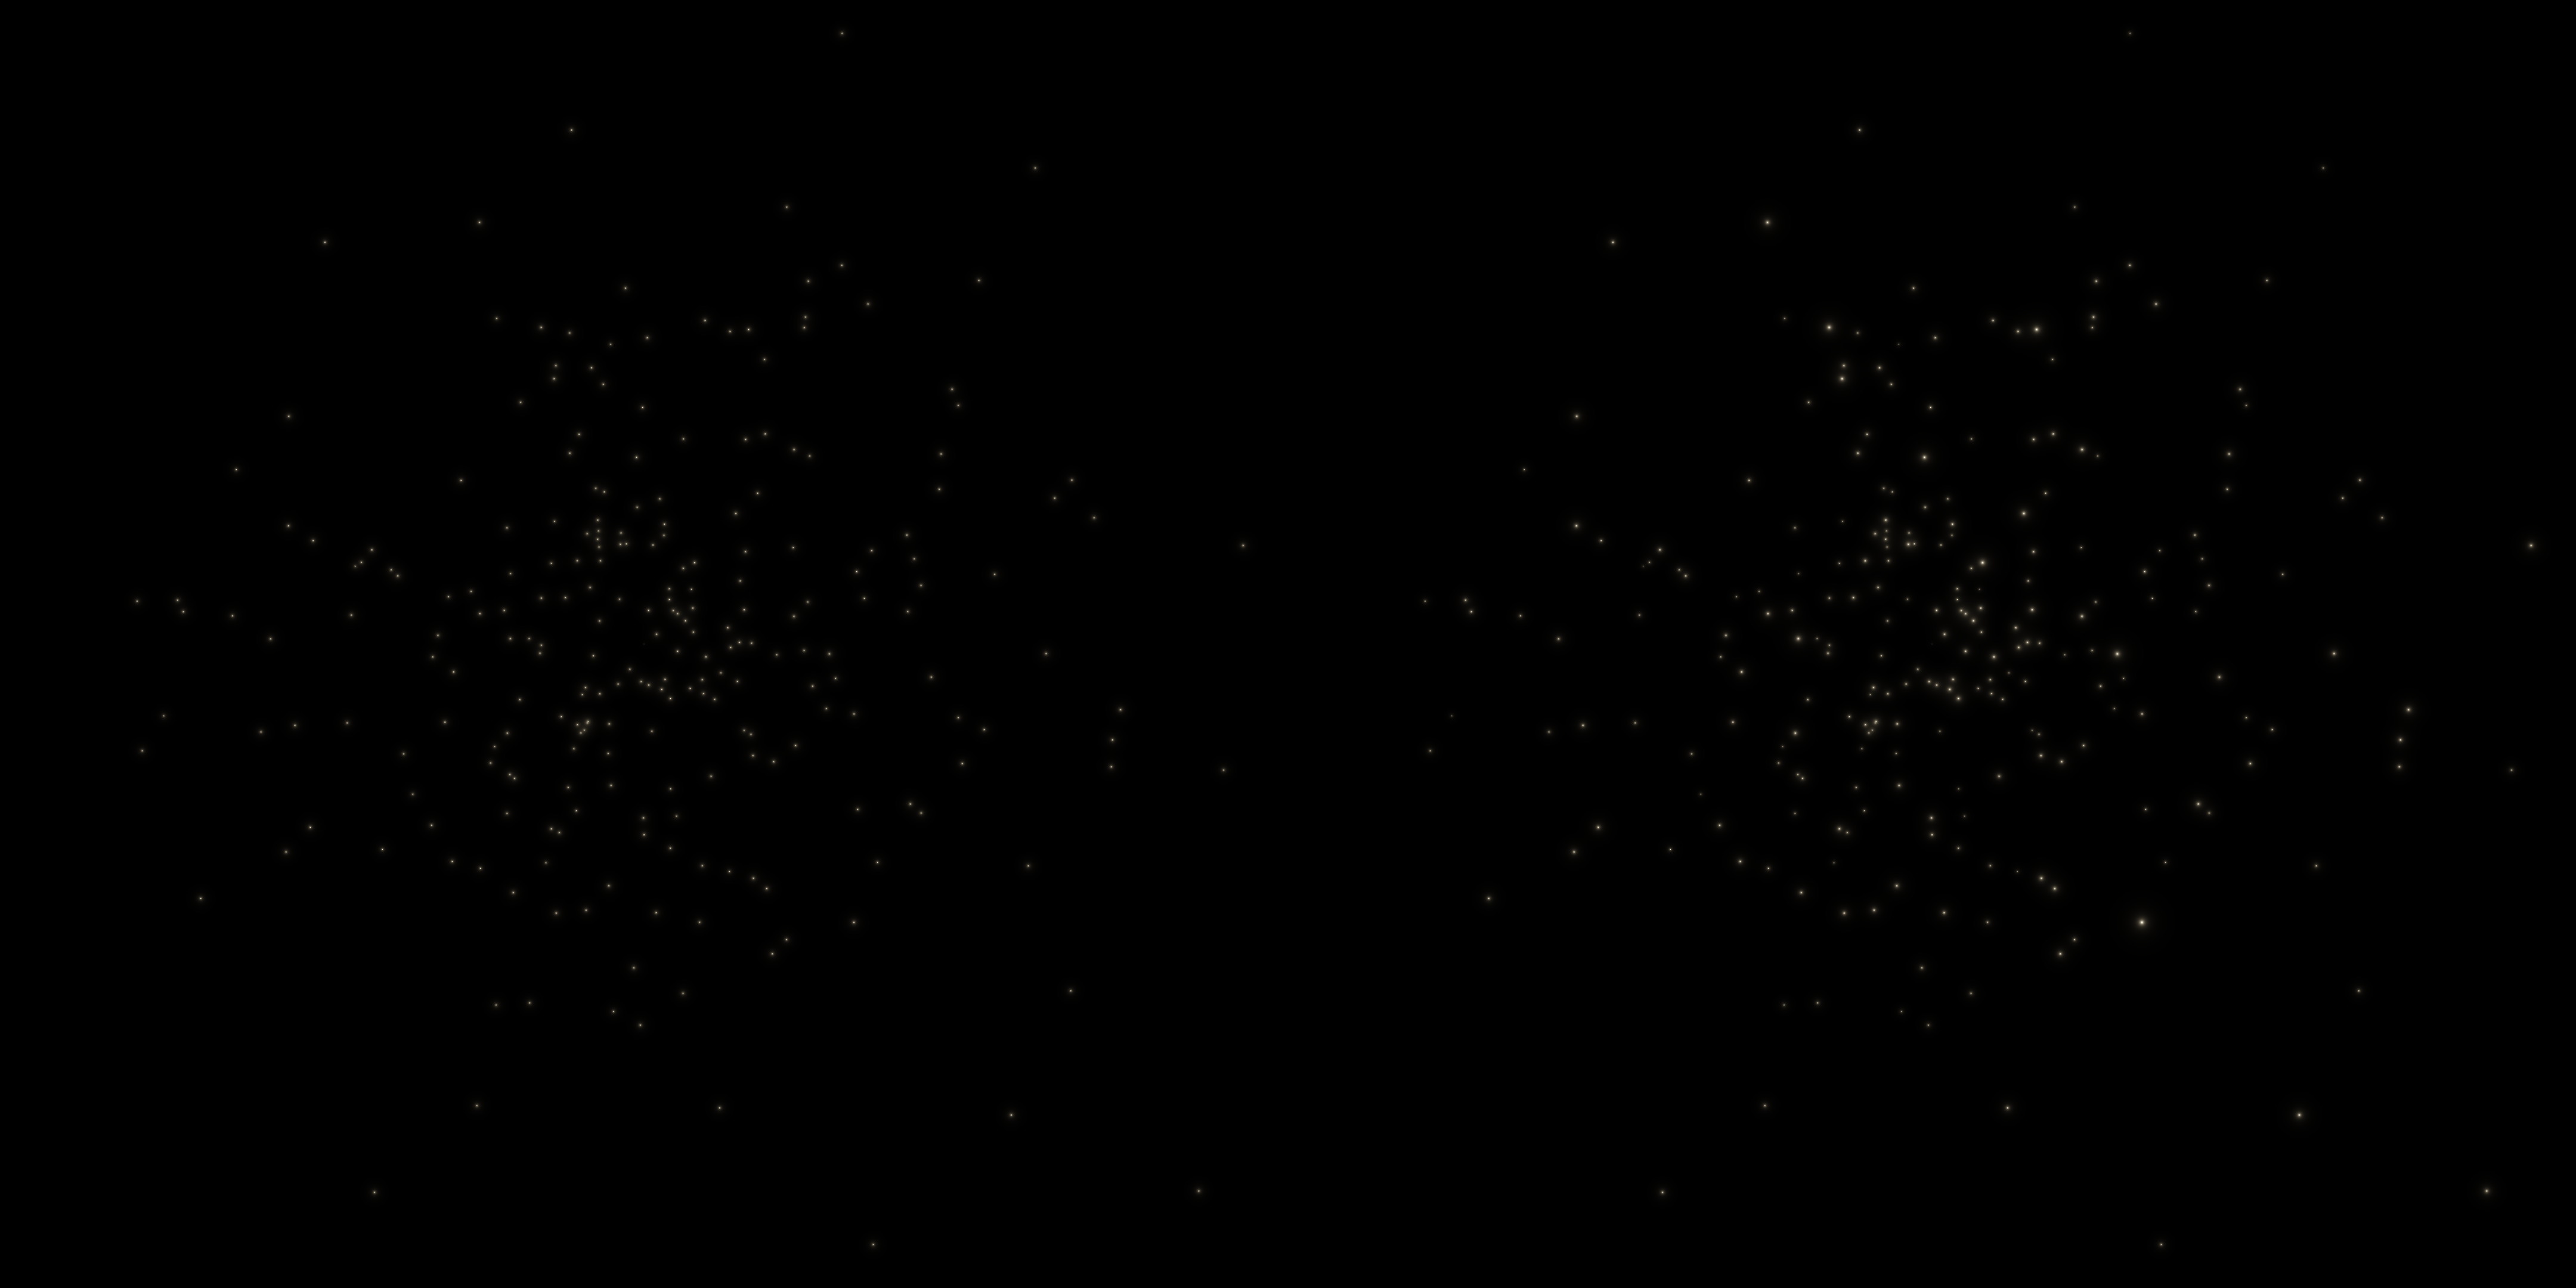 A comparison between globular cluster luminosity generation in 0.990 (left) and 0.991 (right). View the blog post on our website
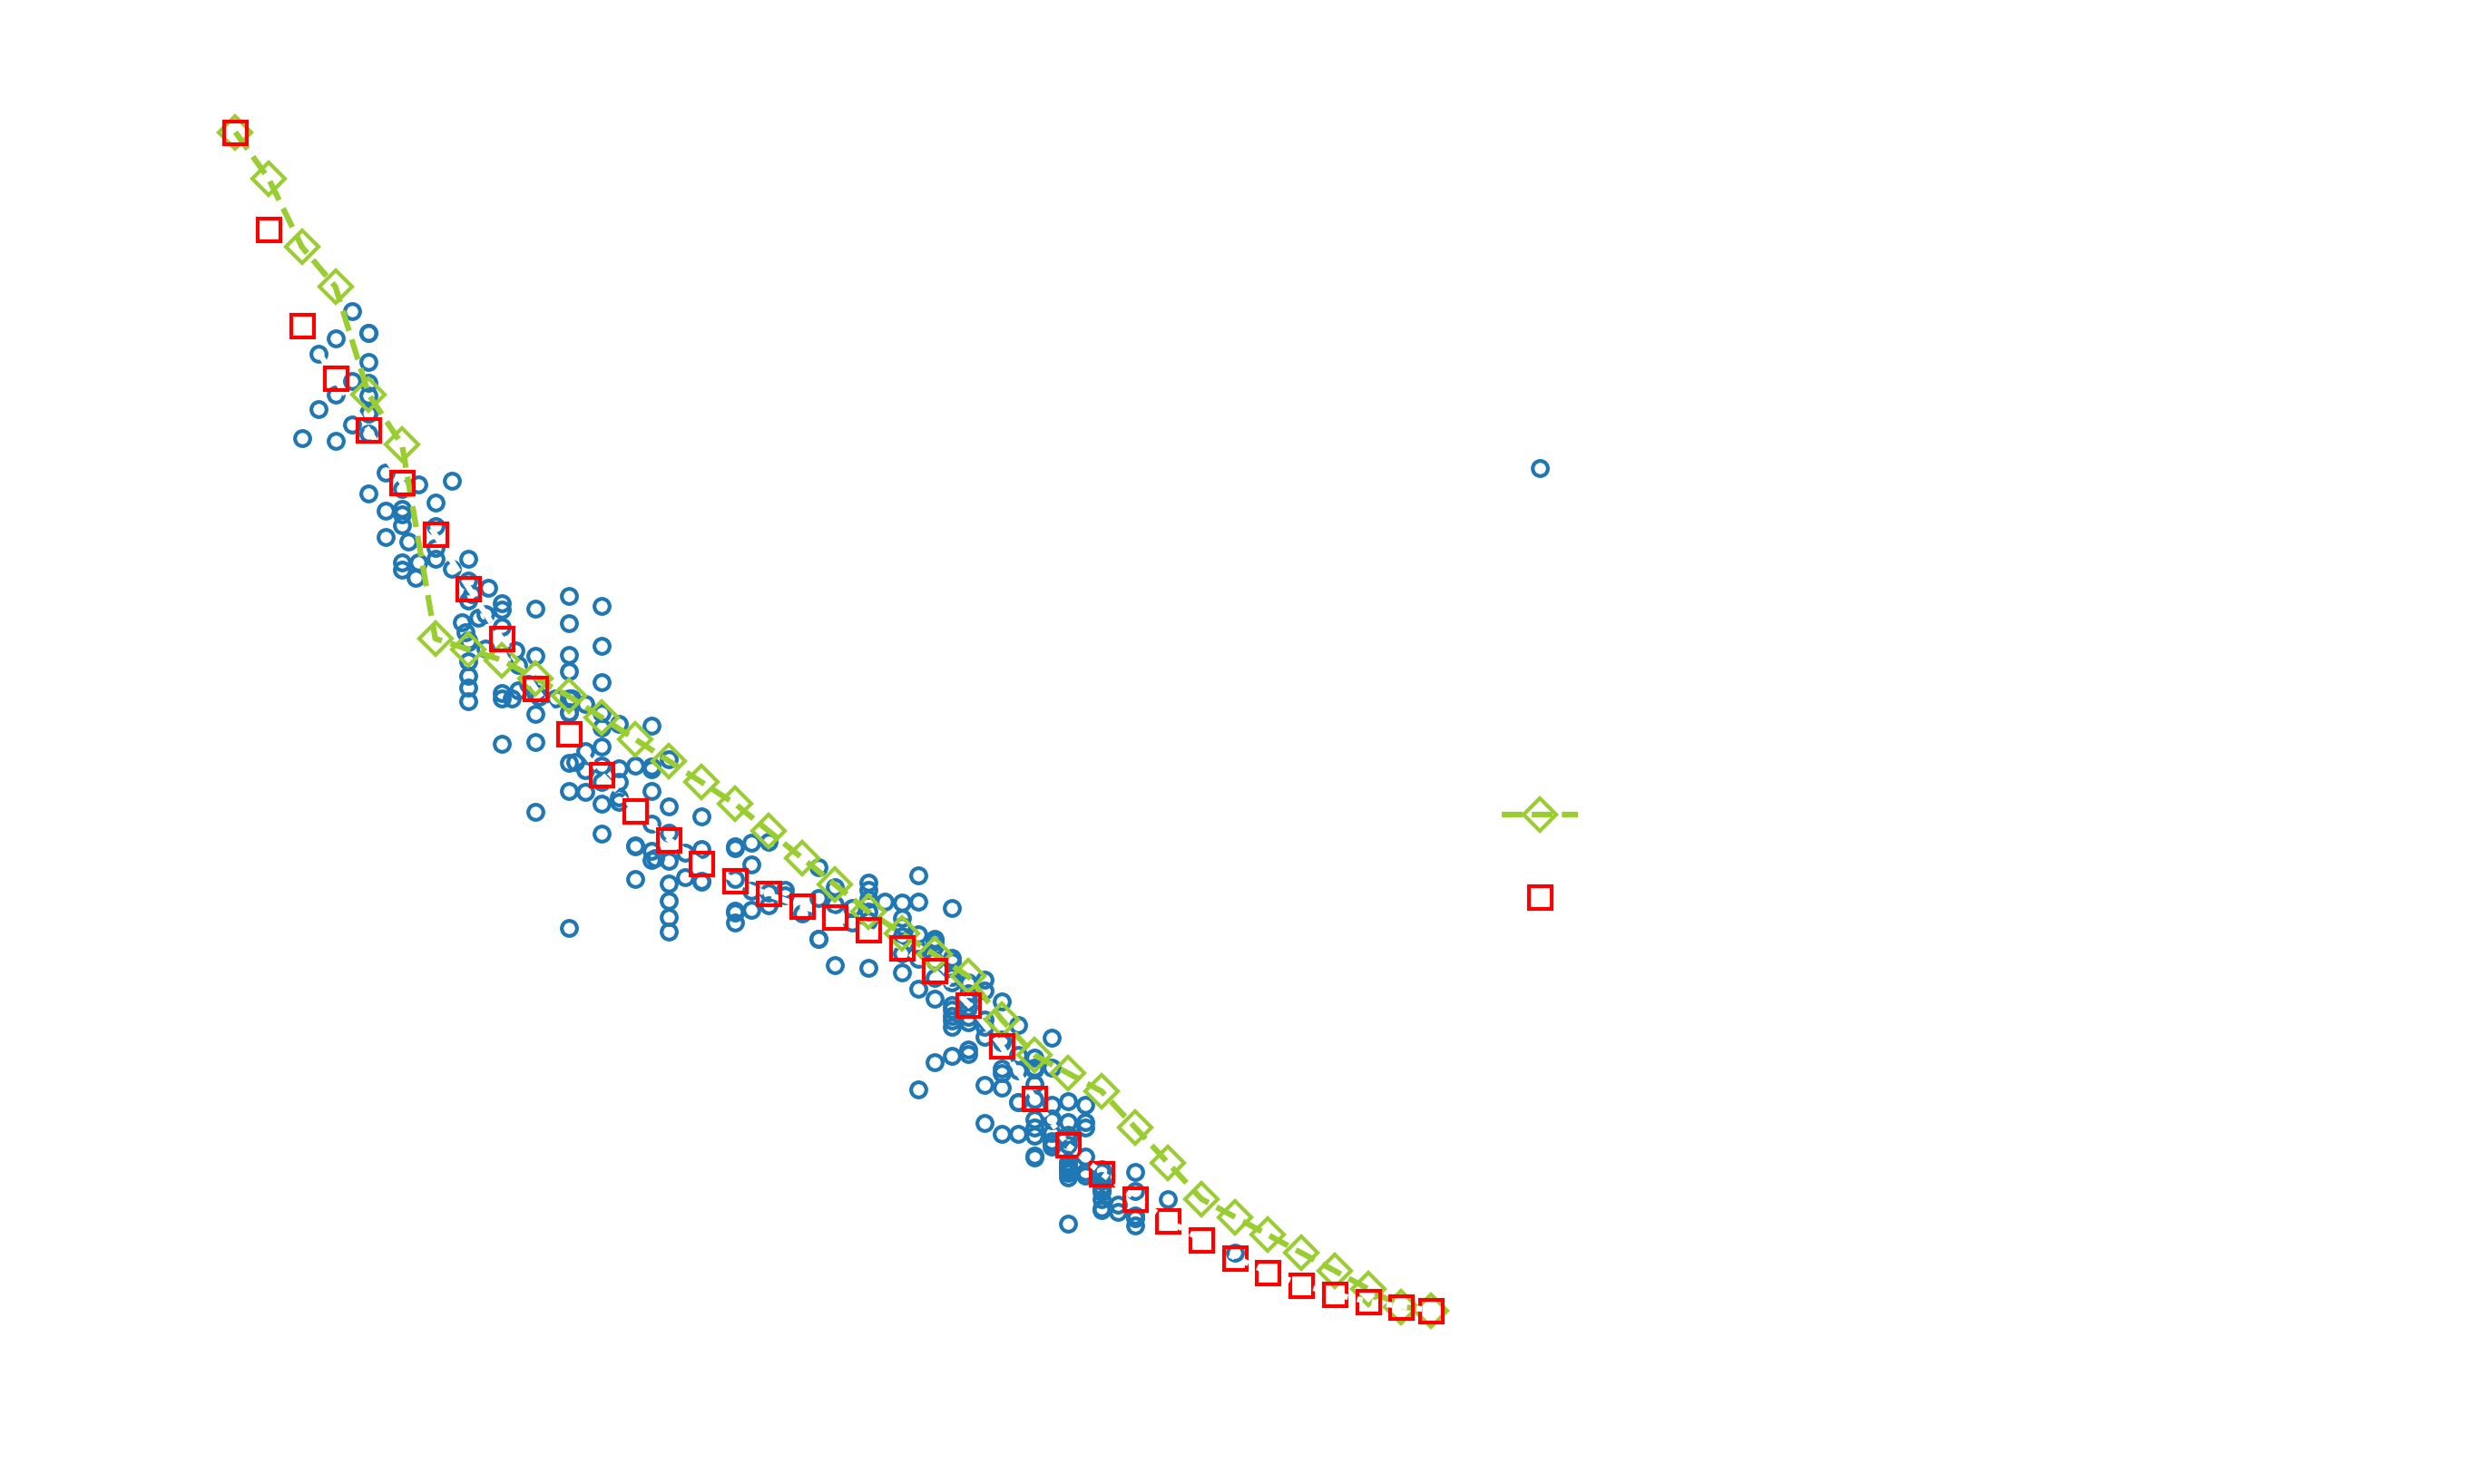 Effective temperature (T_eff ) as a function of spectral type for Ultra Cool Dwarfs. The relationship used in SpaceEngine 0.990 is shown with green diamonds, and the new relationship in 0.991 is shown with red squares. The new relationship is based on data from Filippazzo et al. (2015)
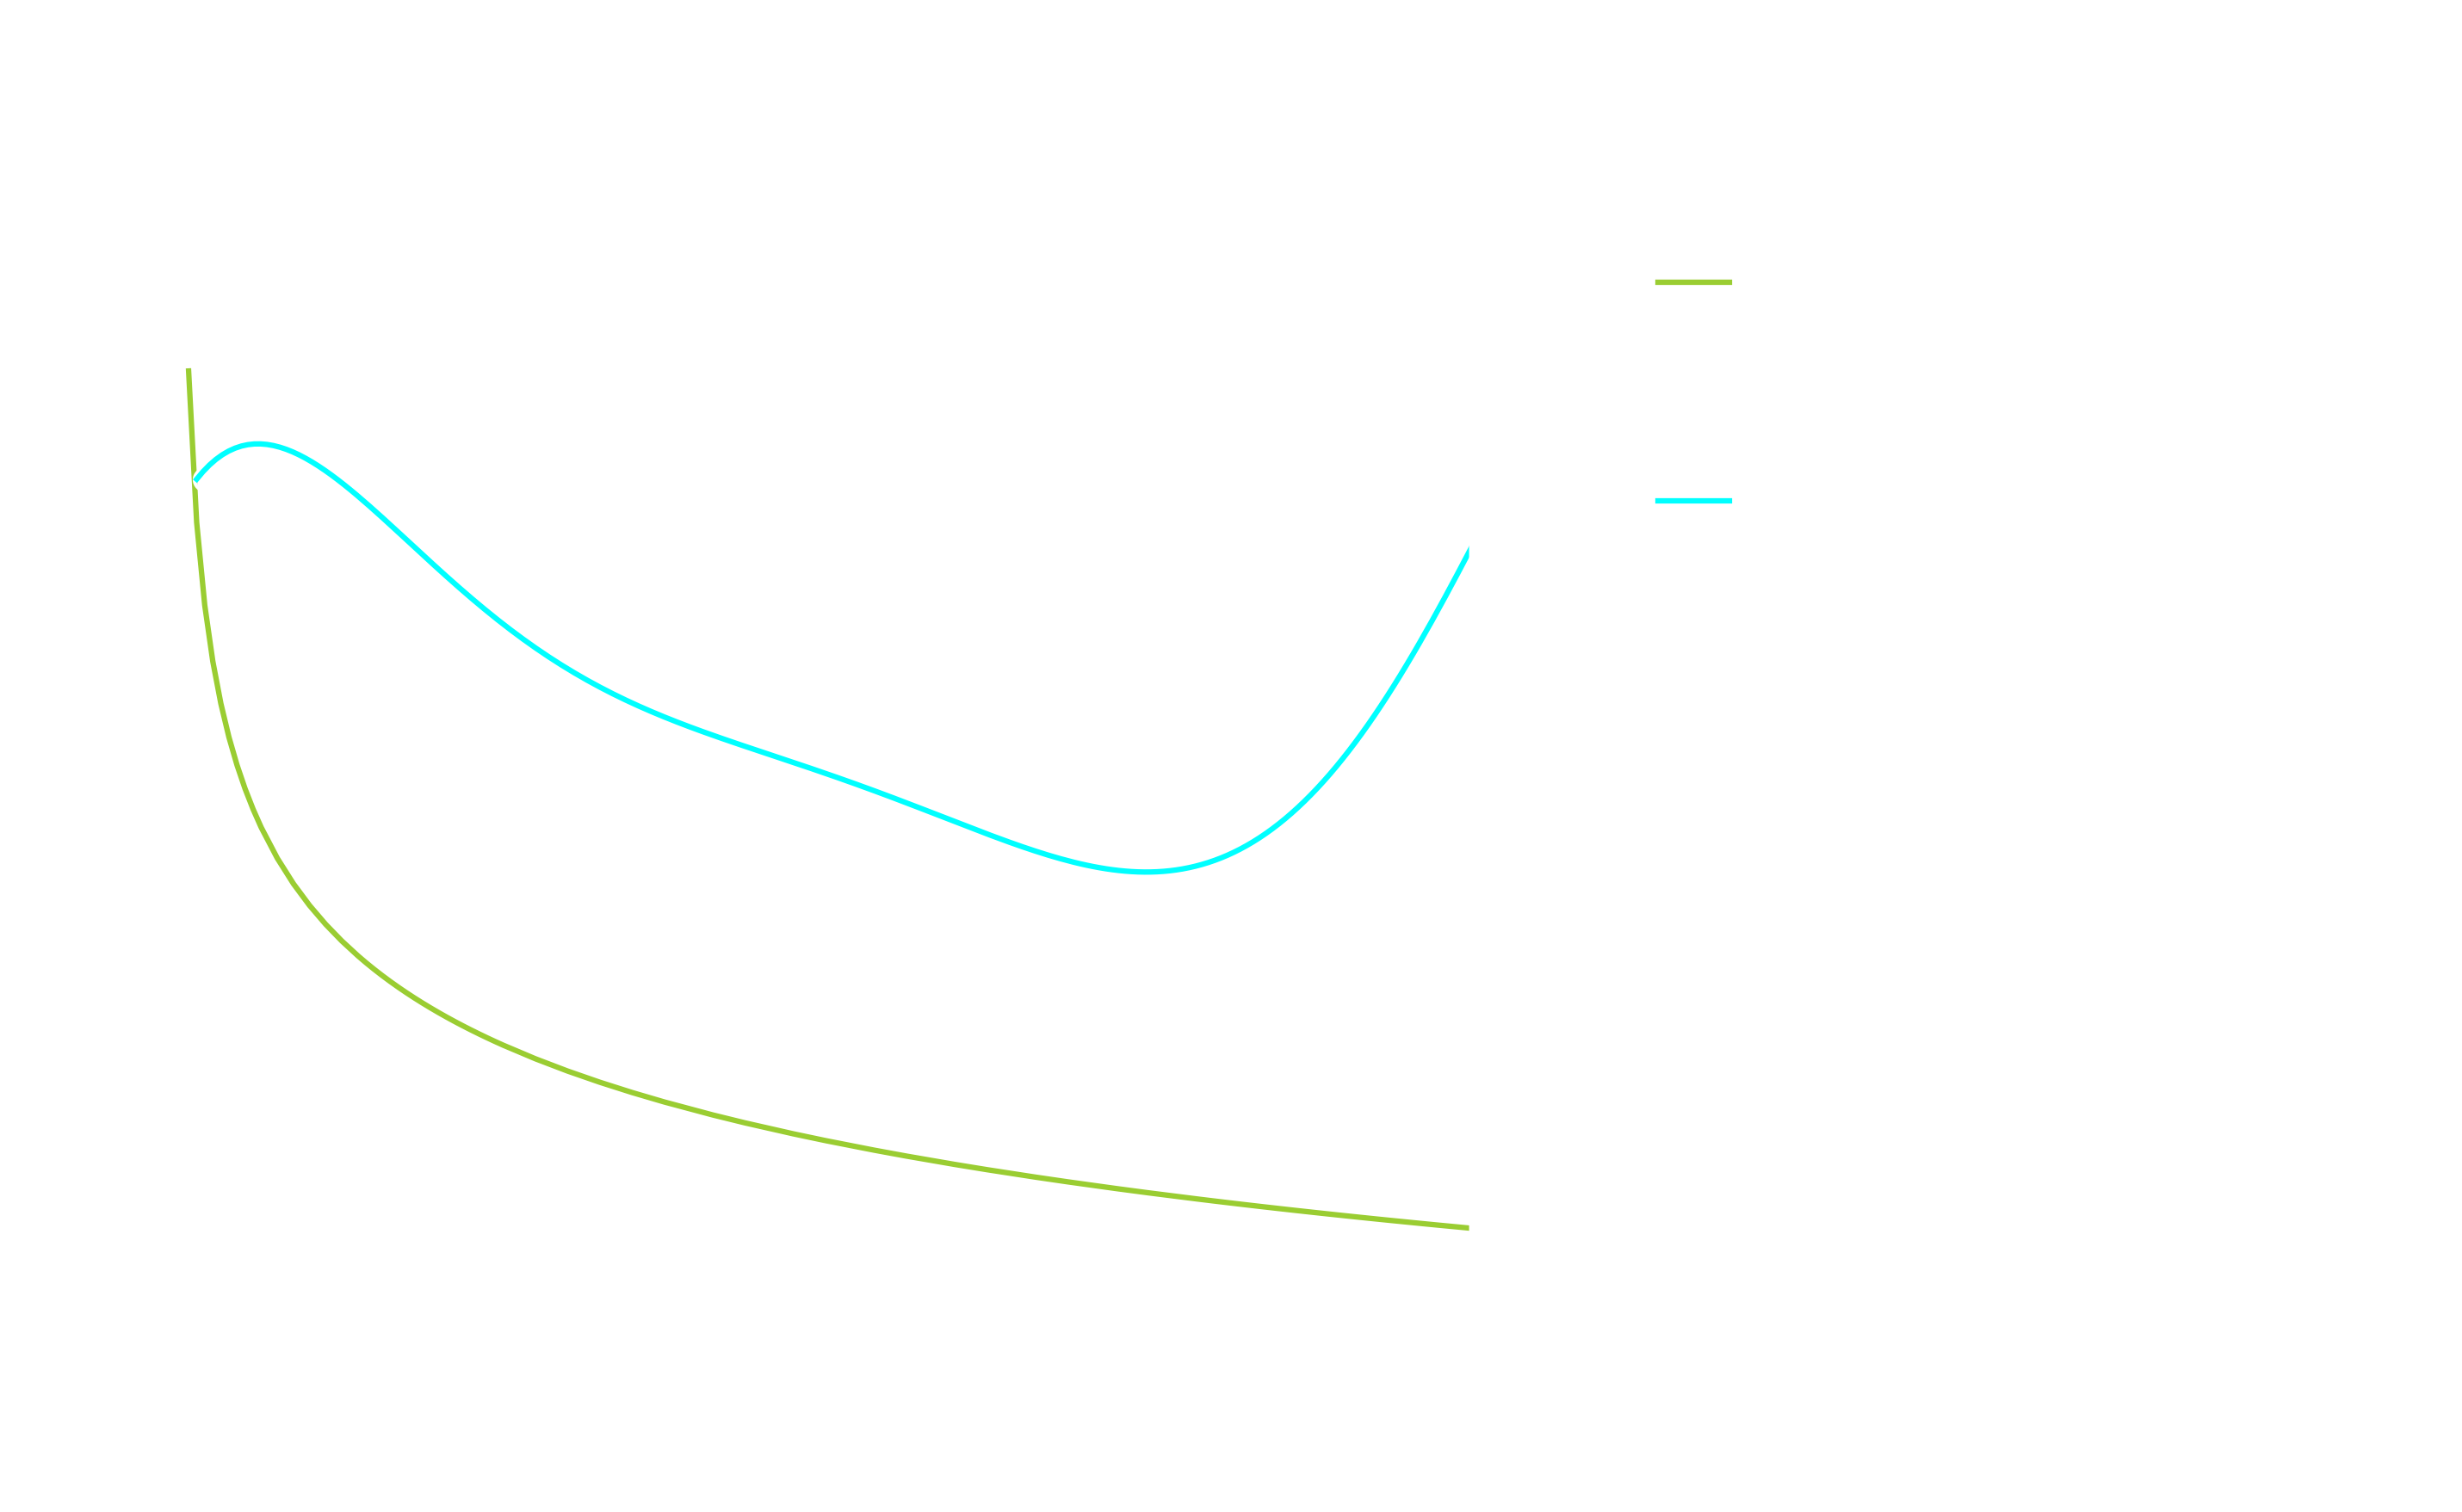 Radius as a function of mass for the typical mass range of field-age (5 Myr) brown dwarfs. The old SpaceEngine radius relationship is shown in green, and the new, revised relationship is shown in cyan. This relationship is a 6th-degree polynomial fit to data from the Sonora brown dwarf evolutionary models (Marley et al. 2021
 Loading
